> 运动
评估模型优劣的常用准则(评估模型的方法)
导语:评估和选择最佳学习模型的一些指标总结
在评估模型时,虽然准确性是训练阶段模型评估和应用模型调整的重要指标,但它并不是模型评估的最佳指标,我们可以使用几个评估指标来评估我们的模型。
因为我们用于构建大多数模型的数据是不平衡的,并且在对数据进行训练时模型可能会过拟合。 在本文中,我将讨论和解释其中的一些方法,并给出使用 Python 代码的示例。
混淆矩阵对于分类模型使用混淆矩阵是一个非常好的方法来评估我们的模型。 它对于可视化的理解预测结果是非常有用的,因为正和负的测试样本的数量都会显示出来。并且它提供了有关模型如何解释预测的信息。 混淆矩阵可用于二元和多项分类。 它由四个矩阵组成:
Fabricating variables:Creating values for FEV1 with 3 classes:FEV1_0 = np.random.normal(4.50, 1, 1000)FEV1_1 = np.random.uniform(3.75, 1.2, 1000)FEV1_2 = np.random.uniform(2.35, 1.2, 1000)Creating labels variable with two classes (1)Disease (0)No disease:no_disease = np.zeros((1500,), dtype=int)disease = np.ones((1500,), dtype=int)Create DataFrame:df = pd.DataFrame()39;FeNO&39;FEV1&39;BD&39;dx&Create X and y:X = df.drop(&39;, axis=1)y = df[&39;]Build the model:logisticregression = LogisticRegression().fit(X_train, y_train)34;training set score: %f&34;test set score: %f& Predicting labels from X_test datay_pred = logisticregression.predict(X_test)39;.1f&39;Predicted Labels&39;True Labels&39;Confusion Matrix&Fabricating variables:Creating values for FEV1 with 3 classes:FEV1_0 = np.random.normal(4.50, 1, 1000)FEV1_1 = np.random.normal(3.75, 1.2, 1000)FEV1_2 = np.random.normal(2.35, 1.2, 1000)Creating labels variable with three classes: no_disease = np.zeros((1000,), dtype=int)possible_disease = np.ones((1000,), dtype=int)disease = np.full((1000,), 2, dtype=int)Create DataFrame:df = pd.DataFrame()39;FeNO&39;FEV1&39;BD&39;dx&Creating X and y:X = df.drop(&39;, axis=1)y = df[&39;]Fit Logistic Regression model:logisticregression = LogisticRegression().fit(X_train, y_train)34;training set score: %f&34;test set score: %f& Predicting labels from X_test datay_pred = logisticregression.predict(X_test)39;.1f&39;Predicted Labels&39;True Labels&39;Confusion Matrix& Printing the model scores:print(classification_report(y_test, y_pred))可以看到,标签 [0] 的精度更高,标签 [1] 的 f1 分数更高。 在二分类的混淆矩阵中,我们看到了标签 [1] 的错误分类数据较少。
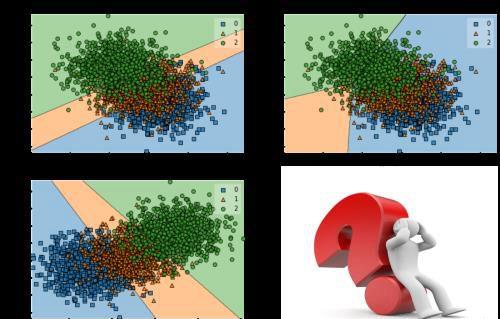
对于多标签分类
Get the values of FPR and TPR:fpr, tpr, thresholds = roc_curve(y_test,logisticregression.decision_function(X_test))plt.xlabel(&34;)plt.ylabel(&34;)plt.title(&34;);39;o&34;threshold zero&34;none&39;k&Get precision and recall thresholds:precision, recall, thresholds = precision_recall_curve(y_test,logisticregression.decision_function(X_test))Plot curve:plt.plot(precision[close_zero], recall[close_zero], &39;, markersize=10,label=&34;, fillstyle=&34;, c=&39;, mew=2)plt.plot(precision, recall, label=&34;)plt.xlabel(&34;)plt.ylabel(&34;)plt.title(&34;);plt.legend(loc=&34;)作者:Carla Martins
本文内容由小萱整理编辑!